| Visit DIX: German-Spanish-German dictionary | diccionario Alemán-Castellano-Alemán | Spanisch-Deutsch-Spanisch Wörterbuch |
The basic idea of diffusion tensor imaging is the same as for Phase Contrast Angiographic MRI. The following sections are mainly a summary of different articles [22].
| (3.1) |
which leads together with the equation of conservation of mass
| (3.2) |
to the diffusion equation:
| (3.3) |
To be able to determine the diffusivity in vivo the diffusion process itself
has to be monitored, i.e., the random motions of an ensemble of particles,
rather than solving the equation for some initial and boundary conditions.
Einstein [10] showed that the diffusion coefficient measured in
the non-equilibrium concentration cell experiments is the same quantity that
appears in the variance of the conditional probability distribution
![]() , the probability of finding a molecule at a position
, the probability of finding a molecule at a position ![]() at a time
at a time ![]() which
was originally at position
which
was originally at position ![]() . For free diffusion this conditional
probability distribution obeys the same diffusion equation as the particle
concentration given. The expectancy is then
. For free diffusion this conditional
probability distribution obeys the same diffusion equation as the particle
concentration given. The expectancy is then
In the case of molecular displacements in tissues, in which diffusion is an
anisotropic process with different molecular mobility in x, y and z
directions, the diffusion constant ![]() has to be replaced by a diffusion
tensor. Equation 3.4 shows that the diffusivity can be inferred
directly by measuring the second moment of the conditional probability
distribution of the diffusing species.
has to be replaced by a diffusion
tensor. Equation 3.4 shows that the diffusivity can be inferred
directly by measuring the second moment of the conditional probability
distribution of the diffusing species.
The basic principles of diffusion imaging can be understood from a simple
bipolar pulsed gradient experiment (see Figure 3.1). The purpose of these gradient
pulses is to magnetically label spins carried by molecules. Here ![]() denotes the gradient strength,
denotes the gradient strength, ![]() as the gradient duration and
as the gradient duration and
![]() as the time interval between the pulses. The first
gradient pulse induces a phase shift
as the time interval between the pulses. The first
gradient pulse induces a phase shift ![]() of the spin transverse
magnetization, which depends on the spin position. If the gradient is along
of the spin transverse
magnetization, which depends on the spin position. If the gradient is along
![]() , then:
, then:
| (3.5) |
![]() is the spin position supposed to be constant during the short duration
is the spin position supposed to be constant during the short duration
![]() of the gradient pulse.
of the gradient pulse. ![]() is the gyromagnetic ratio,
which is a nuclear specific factor. Its value is 42 for hydrogen
is the gyromagnetic ratio,
which is a nuclear specific factor. Its value is 42 for hydrogen
![]() protons. After the 180
protons. After the 180![]() radio frequency (RF) pulse,
radio frequency (RF) pulse, ![]() is transformed into
is transformed into
![]() . Similarly, the second pulse after a delay
. Similarly, the second pulse after a delay ![]() will produce a phase shift
will produce a phase shift
![]() :
:
| (3.6) |
where ![]() is the spin position during the second pulse. The
resulting net dephasing
is the spin position during the second pulse. The
resulting net dephasing ![]() is:
is:
| (3.7) |
It can be seen that for static spins, i.e. not moving molecules ![]() , the bipolar gradient pair produces no net dephasing. For moving
spins there is a net dephasing that will depend on the spin history
during the time interval
, the bipolar gradient pair produces no net dephasing. For moving
spins there is a net dephasing that will depend on the spin history
during the time interval ![]() between the pulses, and which will
affect the transverse magnetization. The position
of the two gradient pulses in each half of the spin-echo sequence does
not matter; it is the time elapsed between them that affects the net
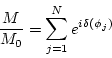
phase. In Nuclear Magnetic Resonance (NMR) the total magnetization is measured, the vector sum of
the magnetic moments
between the pulses, and which will
affect the transverse magnetization. The position
of the two gradient pulses in each half of the spin-echo sequence does
not matter; it is the time elapsed between them that affects the net
phase. In Nuclear Magnetic Resonance (NMR) the total magnetization is measured, the vector sum of
the magnetic moments ![]() of the individual nuclei, which may have
different motion histories:
of the individual nuclei, which may have
different motion histories:
 |
(3.8) |
where ![]() is equilibrium magnetization in the direction of the
static applied magnetic field
is equilibrium magnetization in the direction of the
static applied magnetic field ![]() .
This sum can be evaluated once the net phase distribution is
known. Assuming free diffusion in a homogeneous domain, the probability
of finding a spin at position
.
This sum can be evaluated once the net phase distribution is
known. Assuming free diffusion in a homogeneous domain, the probability
of finding a spin at position ![]() is a constant. If
is a constant. If
![]() is the conditional probability of finding a spin initially at
is the conditional probability of finding a spin initially at ![]() between positions
between positions ![]() and
and ![]() after a time interval
after a time interval ![]() , the
amplitude attenuation is:
, the
amplitude attenuation is:
For free diffusion in one dimension, the conditional probability is given by:
where ![]() is the diffusion coefficient. Combining equations 3.9 and 3.10 leads to:
is the diffusion coefficient. Combining equations 3.9 and 3.10 leads to:
| (3.11) |
This last equation relates the measured signal attenuation to the diffusivity, and is the basis for diffusion measurement using NMR.
Taking several pulses and the fact that ![]() may not be negligible
as compared to
may not be negligible
as compared to ![]() , into account, Equation 3.10 has to be
solved for a general pulse sequence. This leads to the following relation for an isotropic medium
in a spin-echo experiment (for a detailed derivation of these equations
see [22] p. 8, 9).
, into account, Equation 3.10 has to be
solved for a general pulse sequence. This leads to the following relation for an isotropic medium
in a spin-echo experiment (for a detailed derivation of these equations
see [22] p. 8, 9).
| (3.12) |
where
| (3.13) |
Introducing the gradient factor b
| (3.14) |
which characterizes the sensitivity of NMR sequences to diffusion, the signal attenuation can be represented by the simpler expression
Diffusion is a three-dimensional process. However molecular mobility may not be the same in all directions. This anisotropy may be due to the physical arrangement of the medium or the presence of obstacles that limit diffusion (restricted diffusion) or both. Moreover structures that exhibit anisotropic diffusion at the molecular level can be isotropic at the microscopic level.
As mentioned earlier, in anisotropic diffusion the effective diffusion coefficient is replaced by an effective diffusion tensor. The echo attenuation then becomes
| (3.16) |
where ![]() is a b-matrix and
is a b-matrix and ![]() is an effective diffusion tensor. Its
diagonal terms
is an effective diffusion tensor. Its
diagonal terms ![]() ,
, ![]() and
and ![]() represent correlations between
molecular displacements in the same directions, whereas its
off-diagonal terms
represent correlations between
molecular displacements in the same directions, whereas its
off-diagonal terms ![]() ,
, ![]() ,
, ![]() reflect correlations between
molecular displacements in orthogonal directions.
reflect correlations between
molecular displacements in orthogonal directions.
To obtain the different diffusion coefficients at each voxel position, different echo and gradient sequences have been proposed [23].
As can be seen from Table 3.1, diffusion in white matter is extremely variable. The value of the diffusion coefficient directly depends on the relative orientation of the fibers and the magnetic field gradients, which is known as ''anisotropic diffusion.'' Water diffusion in gray matter does not exhibit anisotropy or restriction by impermeable walls [26], [27]. White matter on the other hand is extremely anisotropic, the results of the measurements depending on the respective orientation of the myelin fiber tracts and the gradient direction at each different image location. It appears that diffusion coefficients are significantly decreased when the myelin fiber tracts are perpendicular to the direction of the magnetic field gradient used to measure molecular displacements.
Figure 3.2 shows adjacent myelinated fibers and the diffusion of
water. The diffusion coefficient measured parallel to the myelin fiber
direction ![]() is about three times larger
is about three times larger
![]() mm
mm![]() s
s![]() than the diffusion coefficient perpendicular to
fibers
than the diffusion coefficient perpendicular to
fibers
![]() mm
mm![]() s
s![]() .
.
Since MRI methods in general always obtain a macroscopic measure of a
microscopic quantity which necessarily entails intravoxel averaging,
the voxel dimensions influence the measured diffusion tensor at any
particular location in the brain.
Factors which would affect the shape of the apparent diffusion tensor (i.e., the shape of the diffusion ellipsoid) in the white matter include the density of fibers, the degree of myelination, the average fiber diameter, and the directional similarity of the fibers in the voxel. The geometric nature of the measured diffusion tensor within a voxel is thus a meaningful measure of fiber tract organization.
Although the individual axons and the surrounding myelin sheaths cannot be revealed with the limited spatial resolution of in vivo imaging, distinct bands of white matter fibers with parallel orientation may be distinguished from others running in different directions. Figure 3.3 shows how two crossing fibertracts would ideally be represented by a diffusion tensor image.
Although there is no doubt that diffusion is anisotropic in white matter, controversies about the origin of this anisotropy remain. The diffusion-time dependence of the measured diffusion coefficient is the crucial experimental test for the presence and dimension of diffusive barriers. If diffusion is restricted by impermeable barriers the diffusion coefficient decreases when the diffusion distance reaches the dimension of the available volume. Water in gray and white matter diffuses without encountering significant barriers - at least on the distance range of 8 - 10 microns, which exceeds the dimensions of most cellular compartments [26]. Anisotropy also exists in brains of neonates before the histological appearance of myelin [18]. This leads to the conclusion that myelination is not essential for the diffusion anisotropy of nerves. Nevertheless myelin is widely assumed to be the major barrier to diffusion in myelinated fiber tracts. Therefore the demonstration of anisotropic diffusion in the brain by magnetic resonance has opened the way to explore noninvasively the structural anatomy of the white matter in vivo [16].
In summary, diffusion measurements in vivo reflect complicated
pathways of water molecules in the tissue.
| (3.17) |
so that the loss of signal intensity is (Stejskal Tanner formula)
The data was acquired at the Brigham and Women's Hospital on a GE
Signa 1.5 Tesla Horizon Echospeed 5.6 system with standard 2.2
Gauss/cm field gradients. The time required for acquisition of the
diffusion tensor data for one slice was 1 min; no averaging was
performed. Imaging parameters were: effective TR=2.4s, TE=65ms,
![]() =750 s/mm
=750 s/mm![]() ,
, ![]() =5 s/mm
=5 s/mm![]() , field of view 18 cm, 6
kHz readout bandwidth, acquisition matrix
, field of view 18 cm, 6
kHz readout bandwidth, acquisition matrix ![]() .
.
Usually one coronal and one axial slice with
effective voxel dimensions
![]() mm
mm![]() were
acquired. Newer acquisitions (September 1998 to present) with multiple slices
(between 9 and 14 slices)
have an effective voxel size of
were
acquired. Newer acquisitions (September 1998 to present) with multiple slices
(between 9 and 14 slices)
have an effective voxel size of
![]() mm
mm![]() . Axial and coronal multislice acquisitions locations are chosen
to include the majority of the white matter.
Figure 3.4 shows roughly in a sagittal view the positions from where
axial and coronal, multiple slice diffusion weighted scans were taken.
The factor of in-plane to inter-slice resolution is still very large
(about 7.1 respectively 6.25) so that most processing is done
separately for each slice.
. Axial and coronal multislice acquisitions locations are chosen
to include the majority of the white matter.
Figure 3.4 shows roughly in a sagittal view the positions from where
axial and coronal, multiple slice diffusion weighted scans were taken.
The factor of in-plane to inter-slice resolution is still very large
(about 7.1 respectively 6.25) so that most processing is done
separately for each slice.
![\includegraphics[width = 0.5\textwidth]{images/saggital.eps}](img98.gif)
|
![\includegraphics[width = 0.7\textwidth]{images/pulses2.eps}](img46.gif)
![\includegraphics[width = 0.6\textwidth]{images/fibers.eps}](img88.gif)
![\includegraphics[width = 0.7\textwidth]{images/fibers2.eps}](img89.gif)